
Hi! I'm Paul.
I'm a Postdoc at the Max-Planck-Institute for Metabolism Research in Cologne. I develop visual analytics methods, which combine statistics and visual analysis.
I want to derive insight into large scale data sets.
I'm a Postdoc at the Max-Planck-Institute for Metabolism Research in Cologne. I develop visual analytics methods, which combine statistics and visual analysis.
I want to derive insight into large scale data sets.
I work postdoctoral fellow at the Max Planck Institute for Metabolism Research. I received my PhD from the Computer Science Faculty of the University of Magdeburg.
Skills
Information Visualization
3D Visualization
Image Processing
User Experience Design
RNA-Sequencing Analysis
Programming
Java
Python
Javascript
HTML5/CSS3
C++/C
R
C#
Matlab
LaTeX
As part of my thesis "Interactive Visual Analysis of Population Study Data", I published articles in respected journals and conferences.
For more info, check my and page.
Dissertation Paul Klemm Otto-v.-Guericke University Magdeburg, 2016.
I device new methods for analyzing large scale population study data. Disease risk factors are extracted based on data-driven methods that combine data mining and visual exploration approaches. I provide insight into large data sets by joining the pattern recognition power of both the computer and human vision.
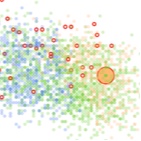
Journal Paper Paul Klemm, Kai Lawonn, Sylvia Glaßer, Uli Niemann, Katrin Hegenscheid, Henry Völzke, Bernhard Preim. IEEE Transactions on Visualization and Computer Graphics (TVCG), 22 (1), pp. 81-90, 2015.
We relate mammography scans to breast cancer using an angular/D3 web app. A 3D heatmap overview visualization allows epidemiologists to extract variables correlating with cancer and other target conditions.
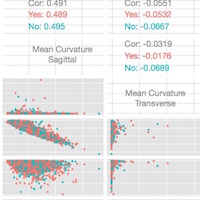
Paul Klemm, Sylvia Glaßer, Kai Lawonn, Marko Rak, Henry Völzke, Katrin Hegenscheid, Bernhard Preim Proc. of the 6th International Conference on Information Visualization Theory and Applications (IVAPP), pp. 85-92, 2015.
Using R and Matlab, we correlate the lower spine shape with back pain. A quality plot of decision trees allows experts to assess the predictive power of the shape features w.r.t. target conditions.
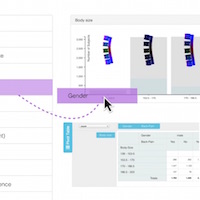
Journal Paper Paul Klemm, Steffen Oeltze-Jafra, Kai Lawonn, Katrin Hegenscheid, Henry Völzke, Bernhard Preim IEEE Transactions on Visualization and Computer Graphics (TVCG), pp. 1673-1682, 2014.
We propose a visual analysis workflow for image-based analysis of cohort study data. We analyze lumbar back pain in a web-based framework, which combines information visualization and 3D shape variance visualization.
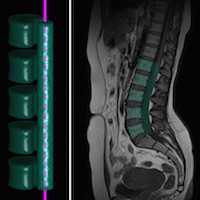
Paul Klemm, Kai Lawonn, Marko Rak, Bernhard Preim, Klaus Tönnies, Katrin Hegenscheid, Henry Völzke, Steffen Oeltze Proc. of Vision Modeling Visualization (VMV), pp. 121-128, 2013.
We incorporate detection models to obtain lumbar spine shape groups based on hierarchical clustering. A shape variance visualization highlights inter-group differences.